We explain what your stress values really mean

What stress really means

Stress is more than a feeling and more than a single measured value. We want you to understand the biological background: when activation is useful, when stress can become problematic and why recovery, timing and everyday context play a central role in interpretation. Our team explains your results personally. Here, you will find the key principles summarized clearly in advance.

What is stress?

Stress is a normal biological response to demands. The body activates systems that provide energy, increase attention and enable fast action. The key question is not whether stress occurs, but how long activation lasts, whether recovery follows and in which context the measured values arise.

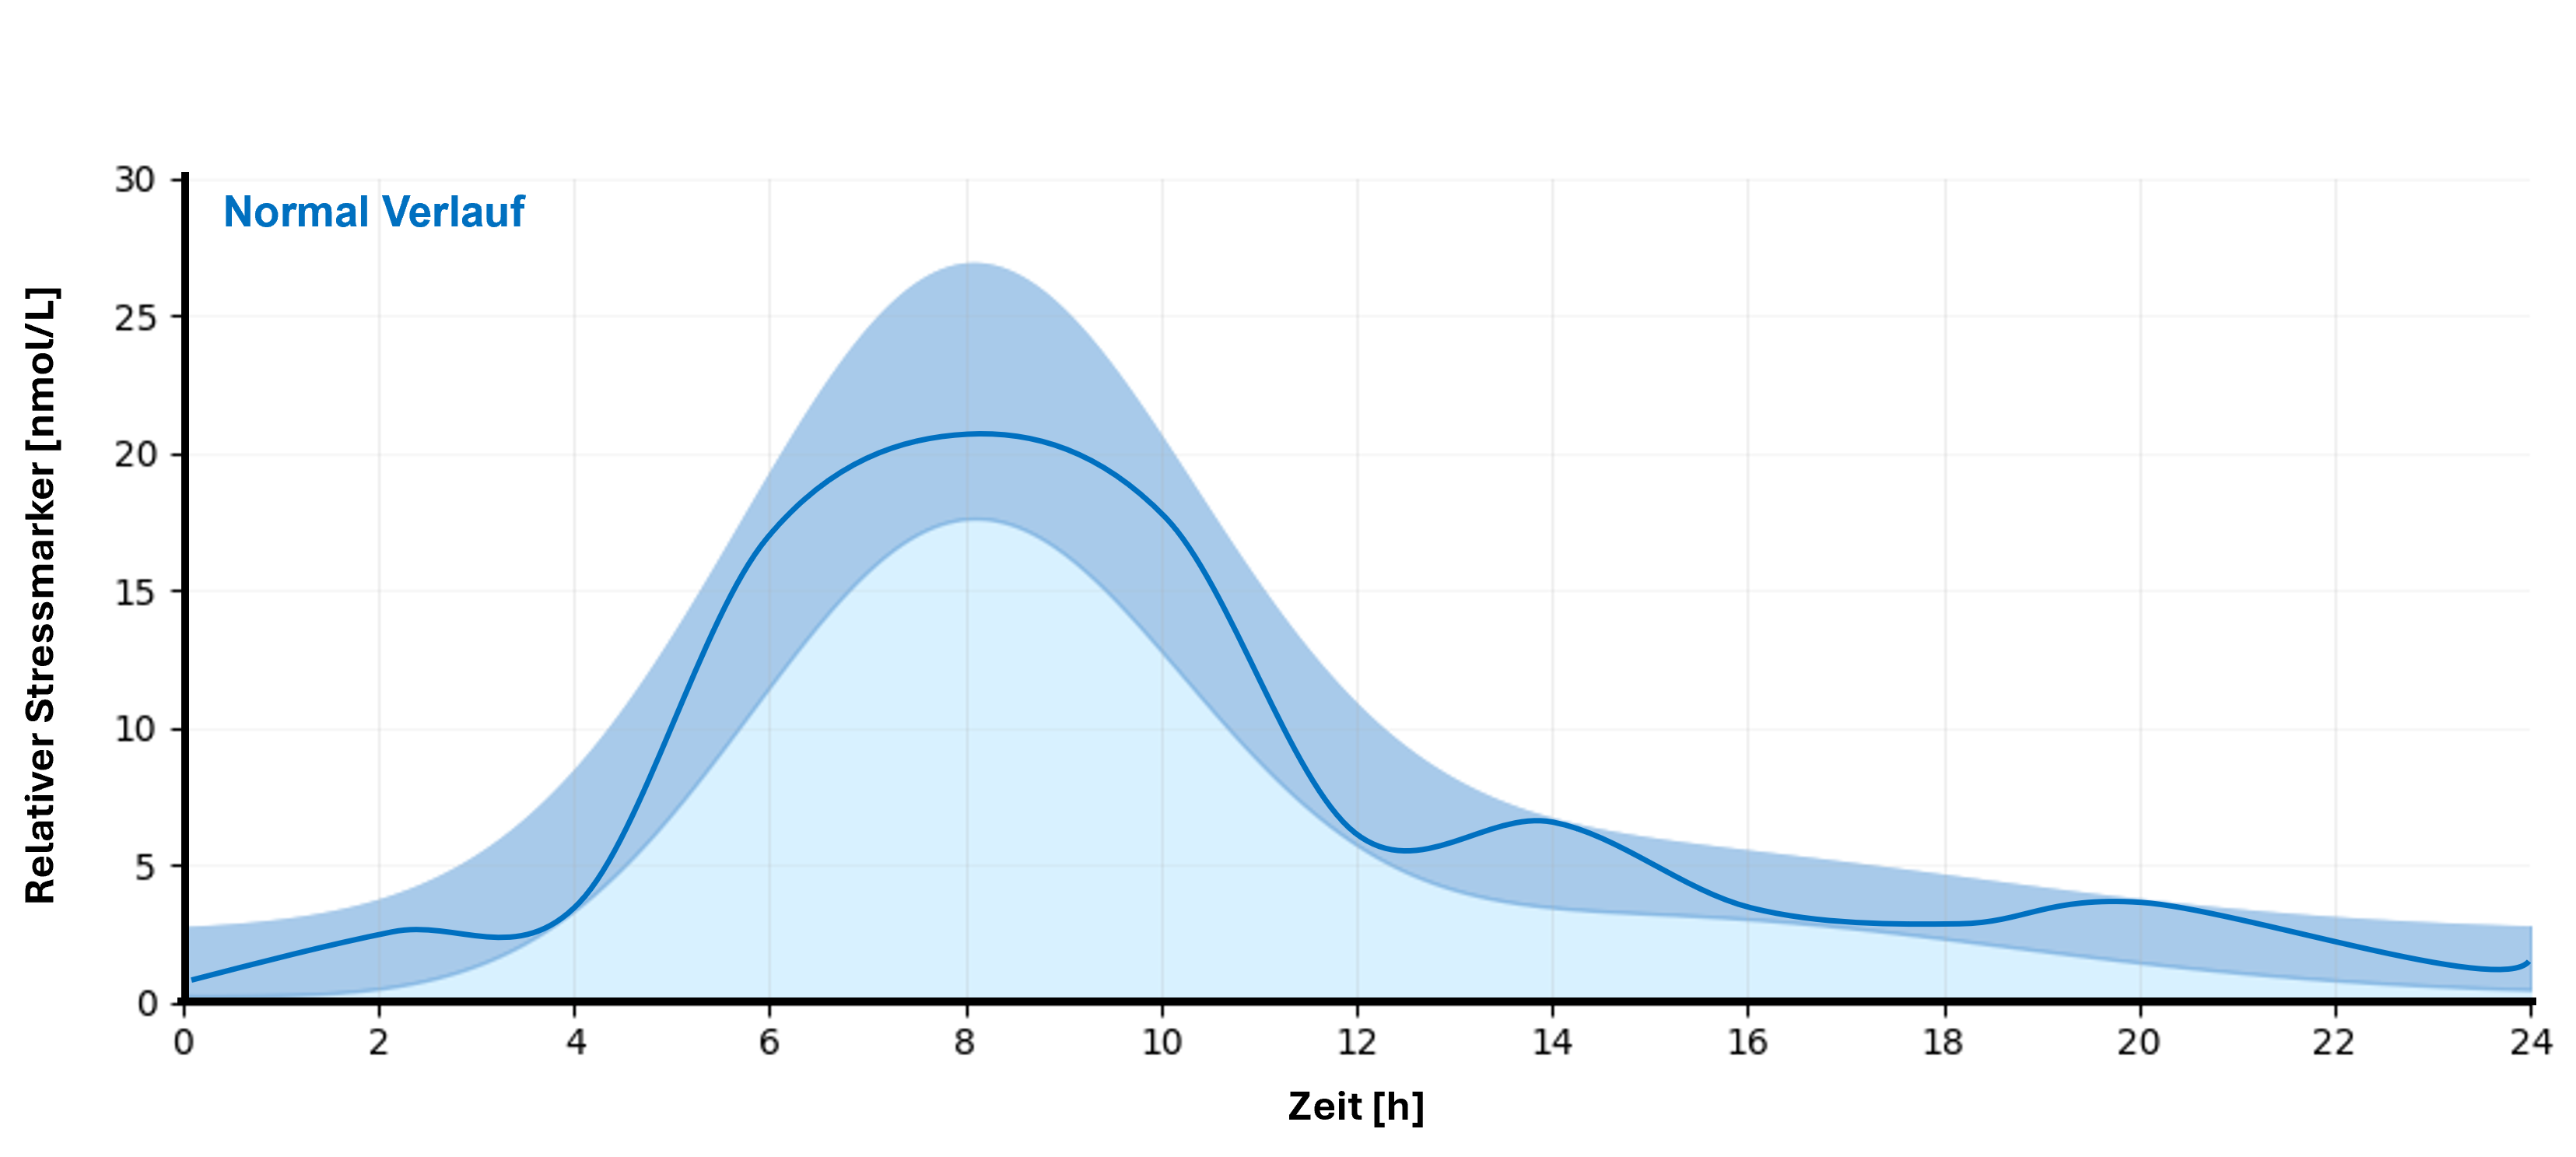
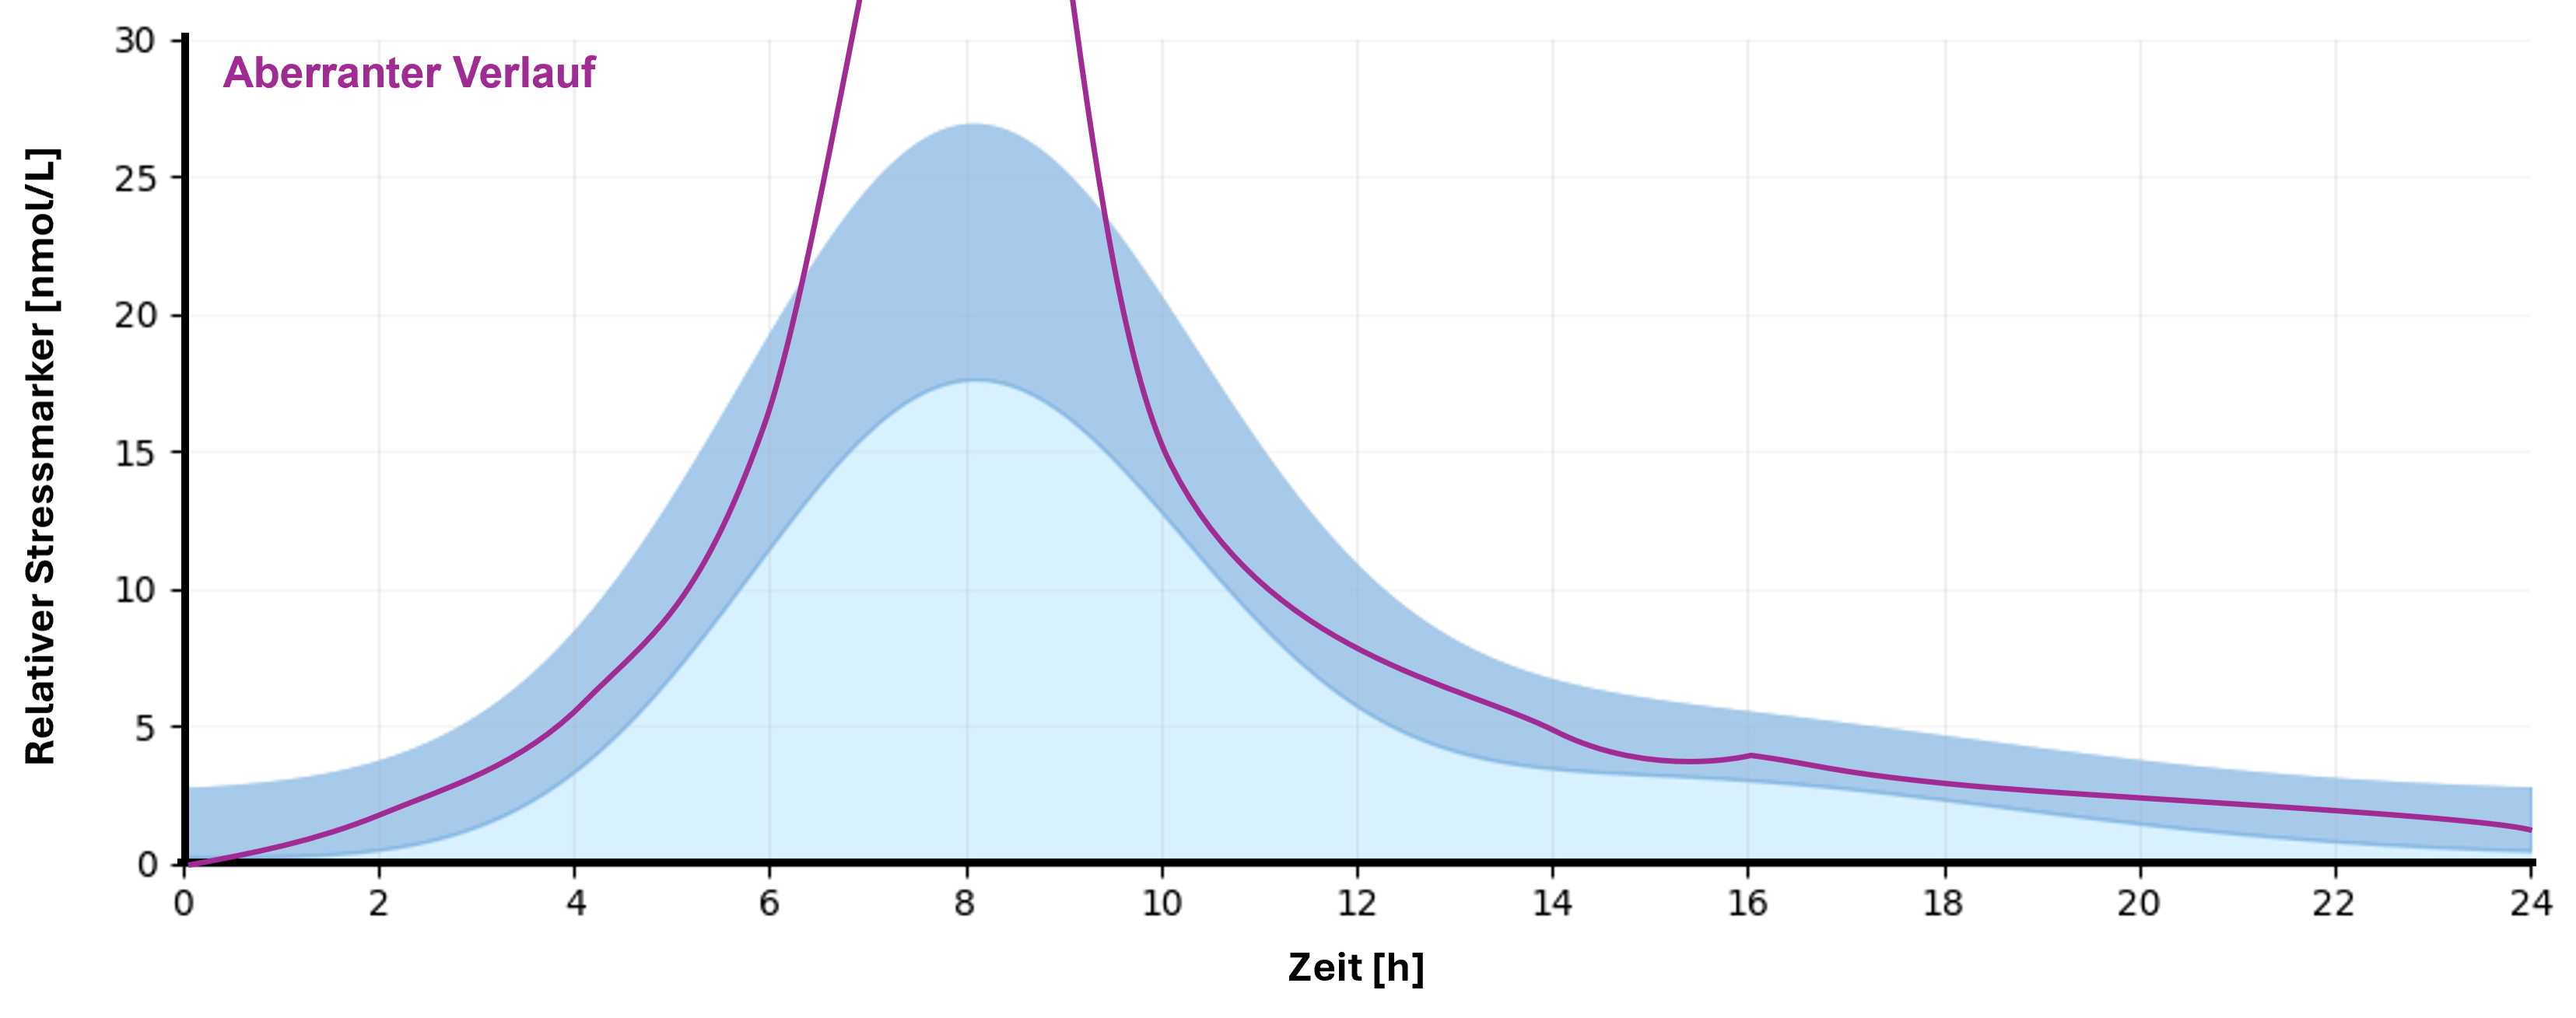
Stress is initially a normal biological activation. The body and brain provide energy, increase attention and enable fast action. Acute stress can therefore support focus, performance and reaction speed. The key question is not whether stress is present, but how well the body regulates it: Time-limited activation is functional, while sustained activation without sufficient recovery can indicate dysregulation.

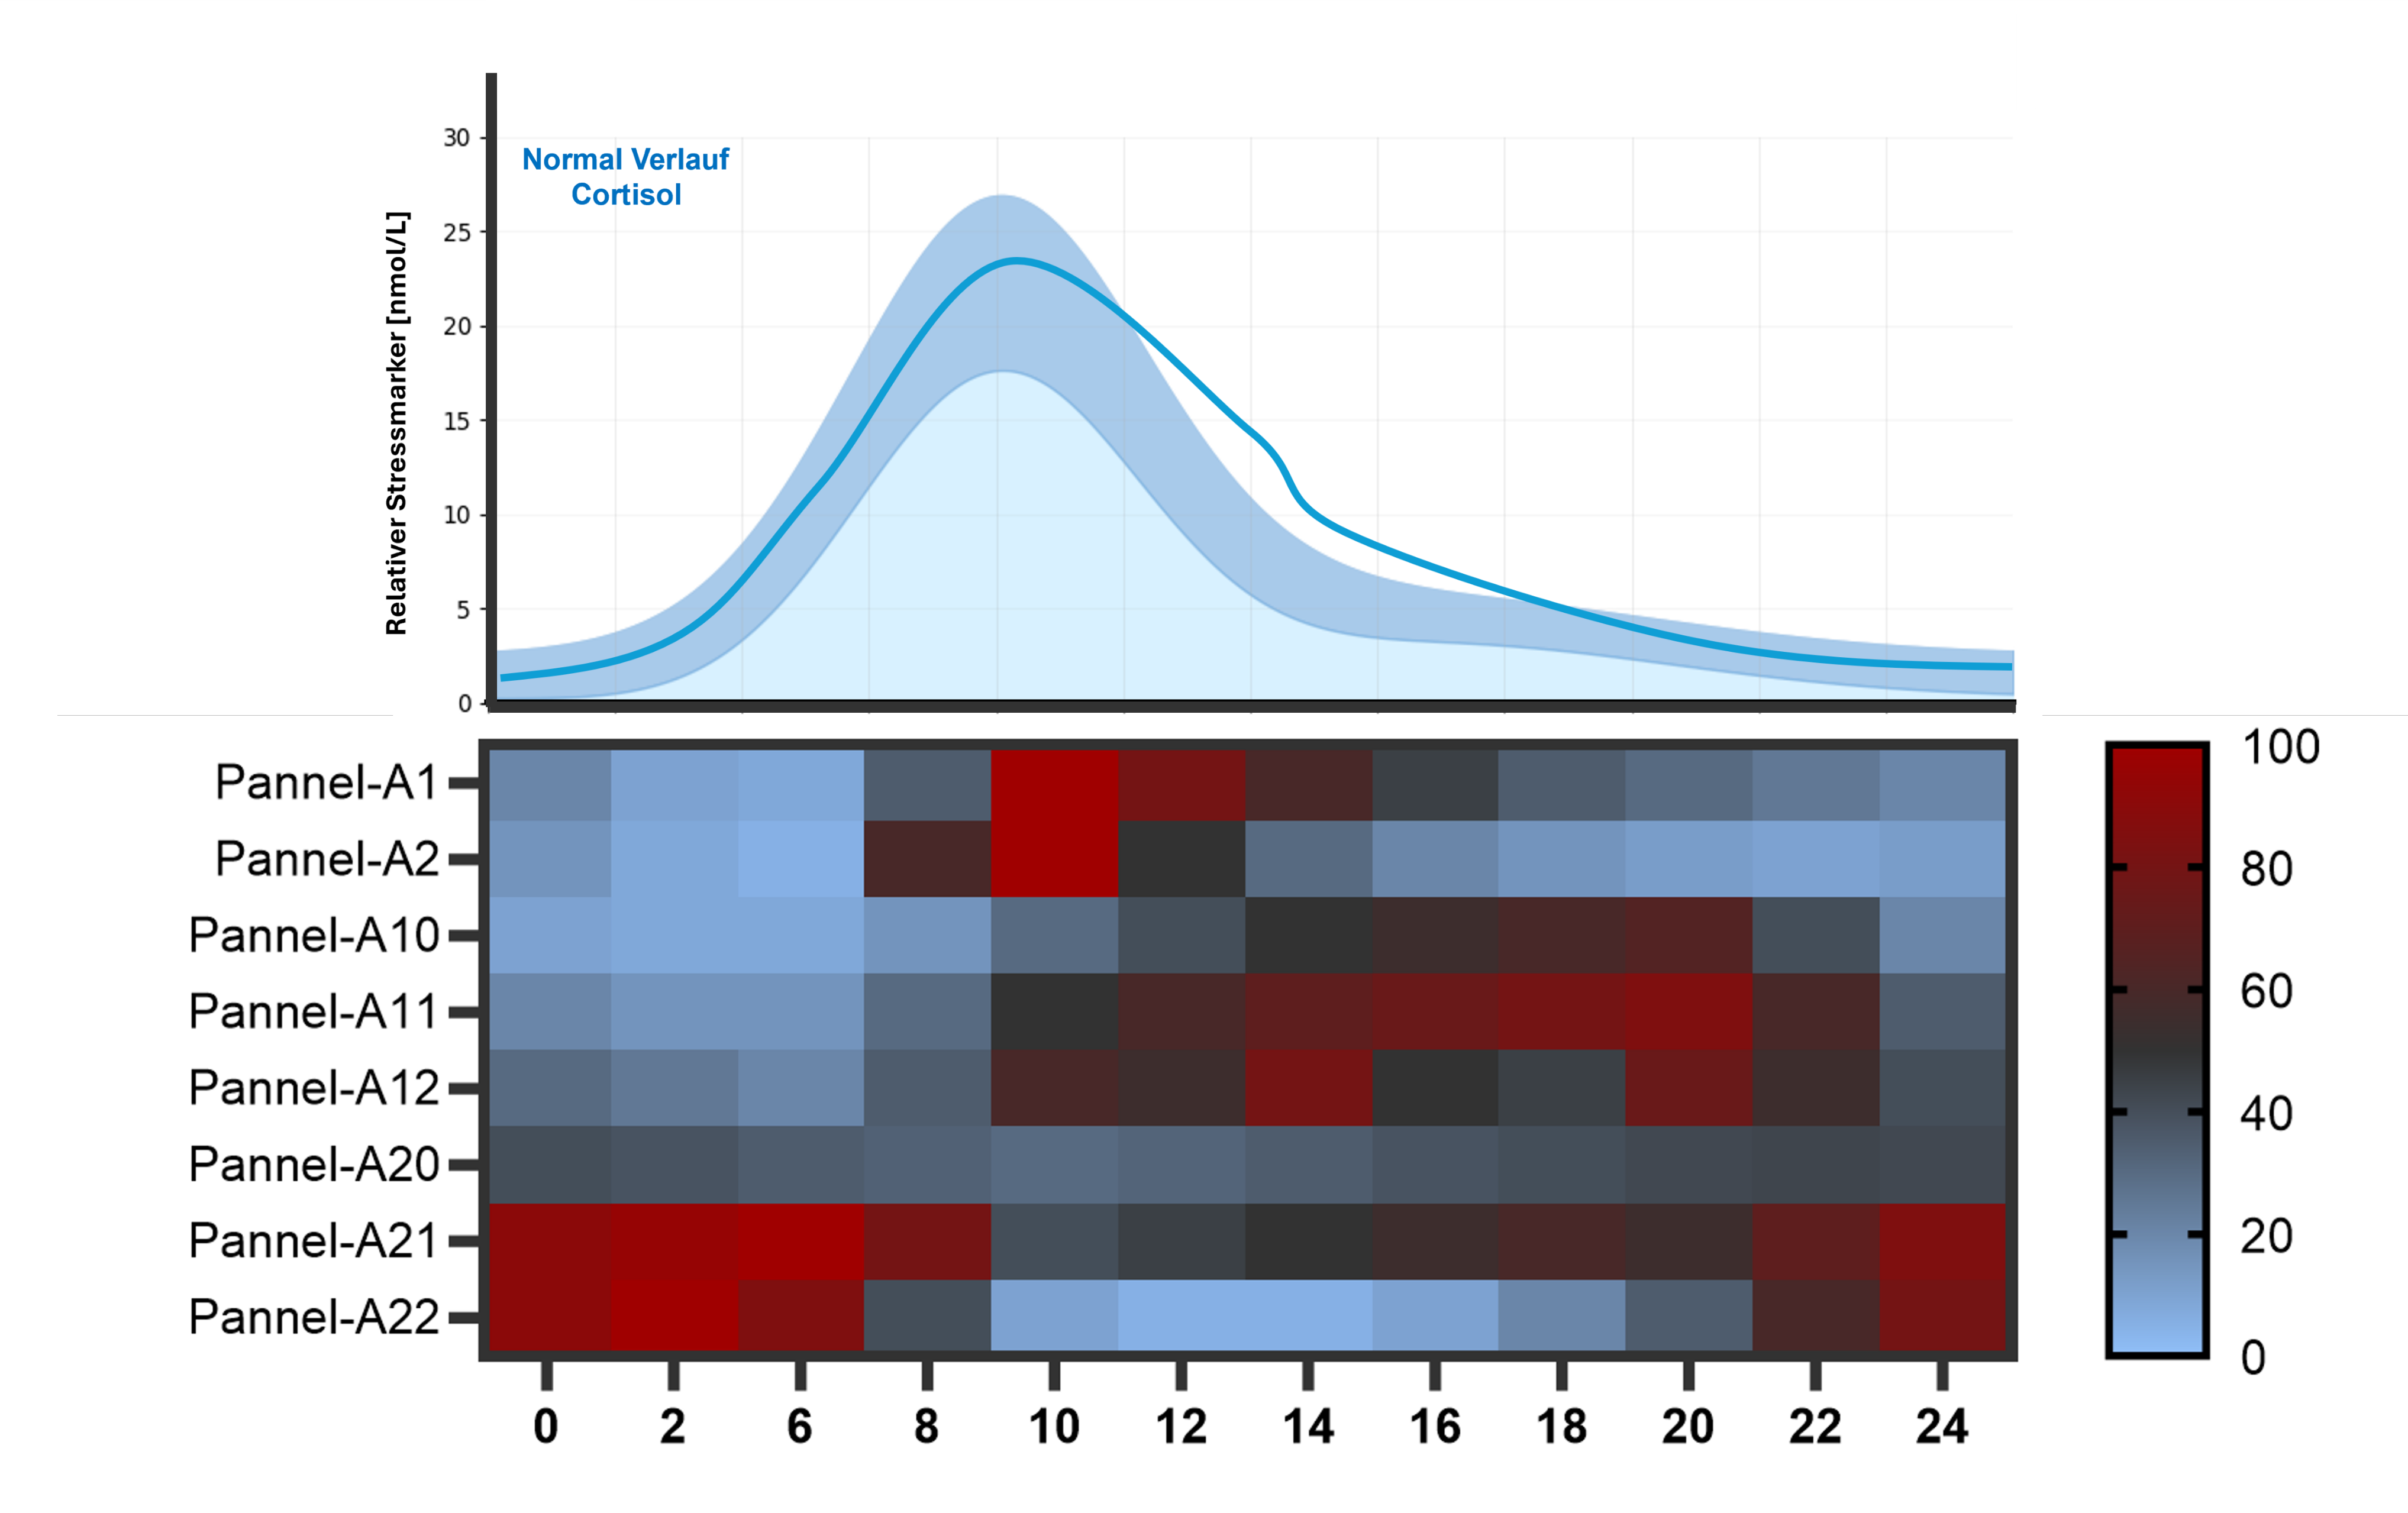
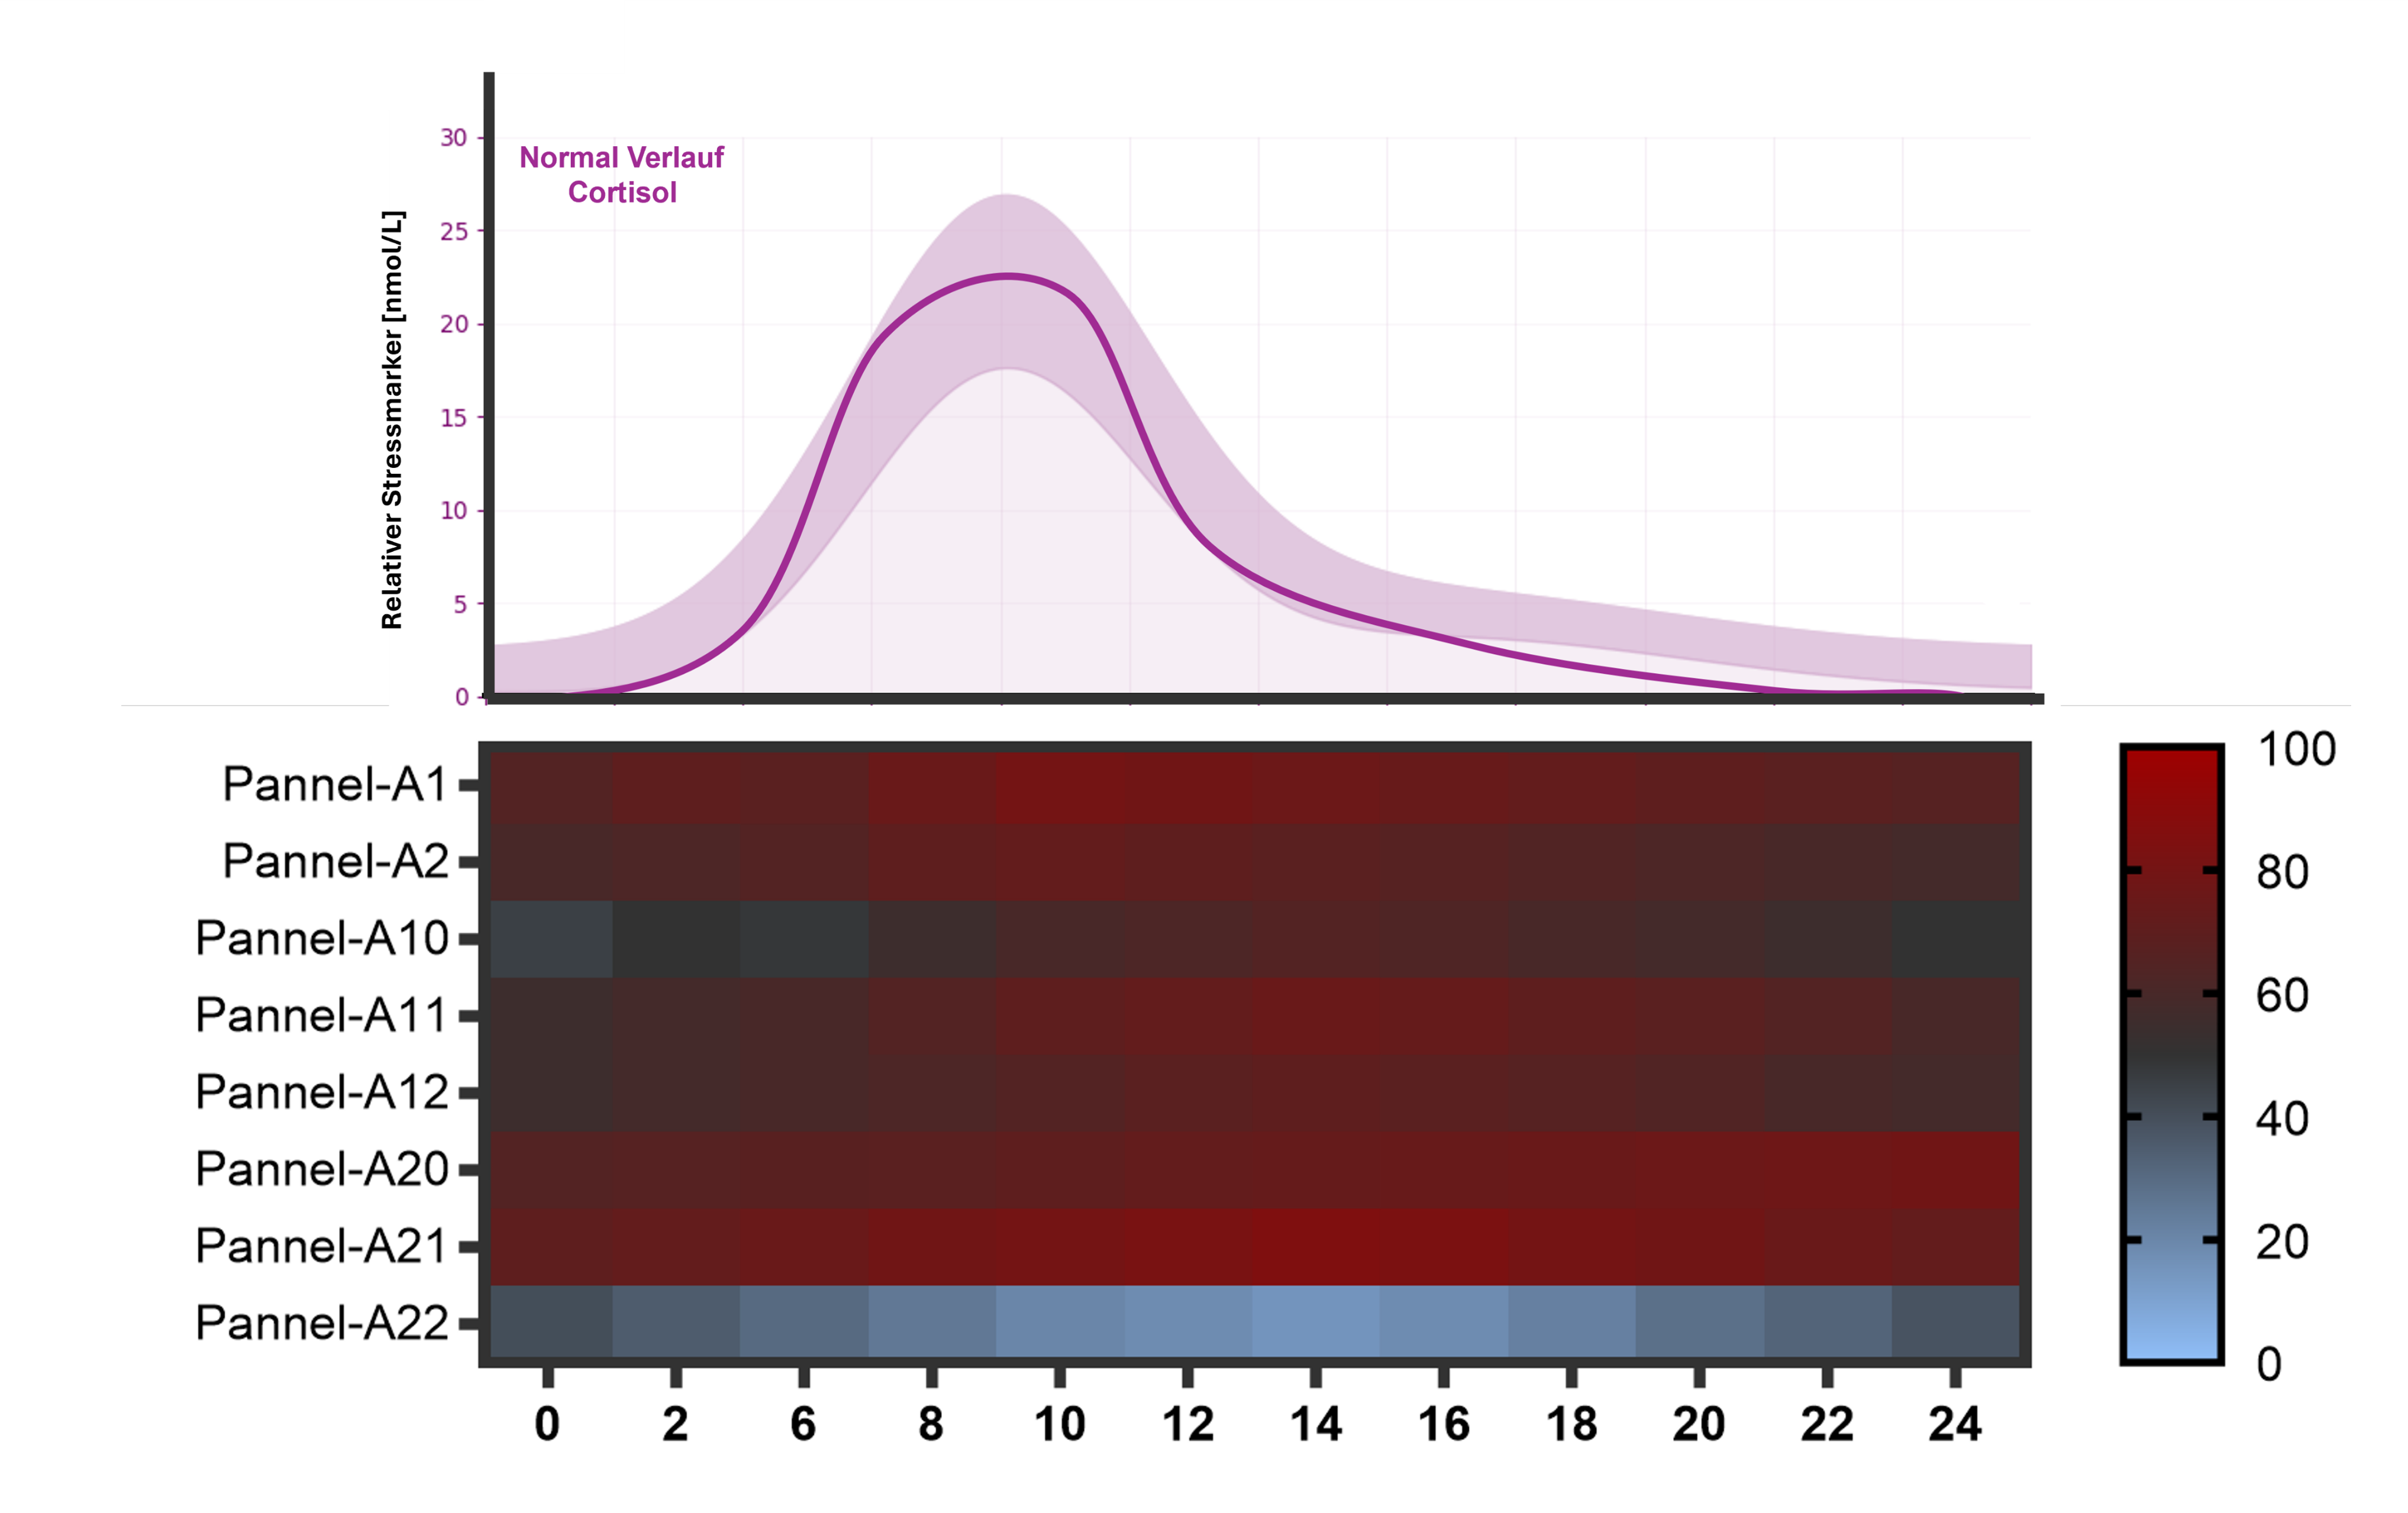
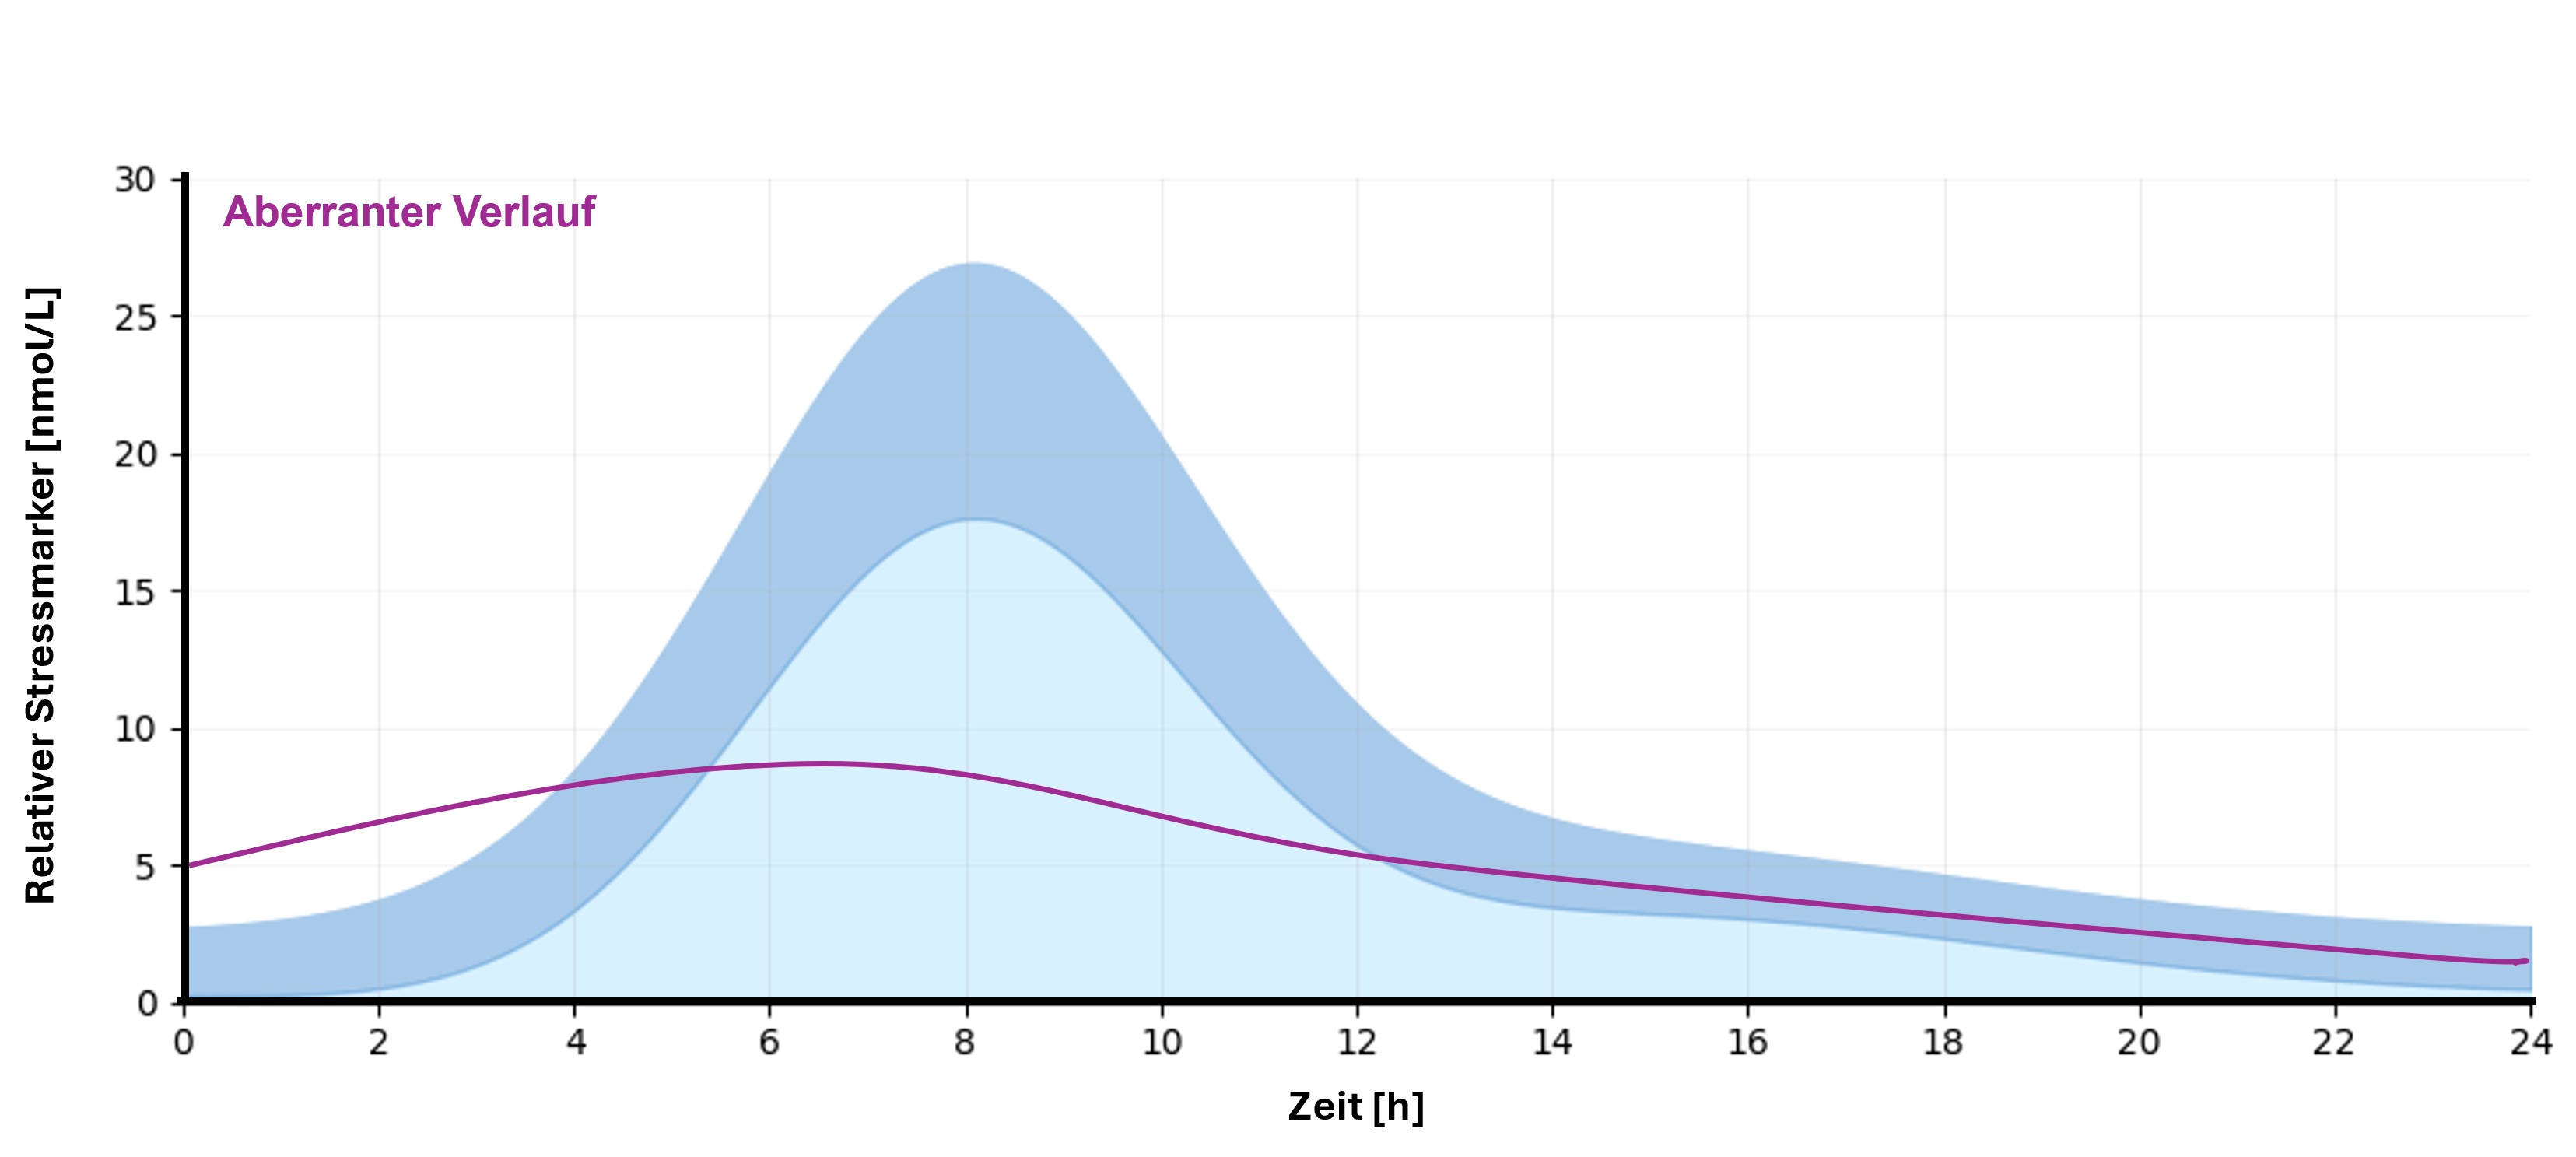
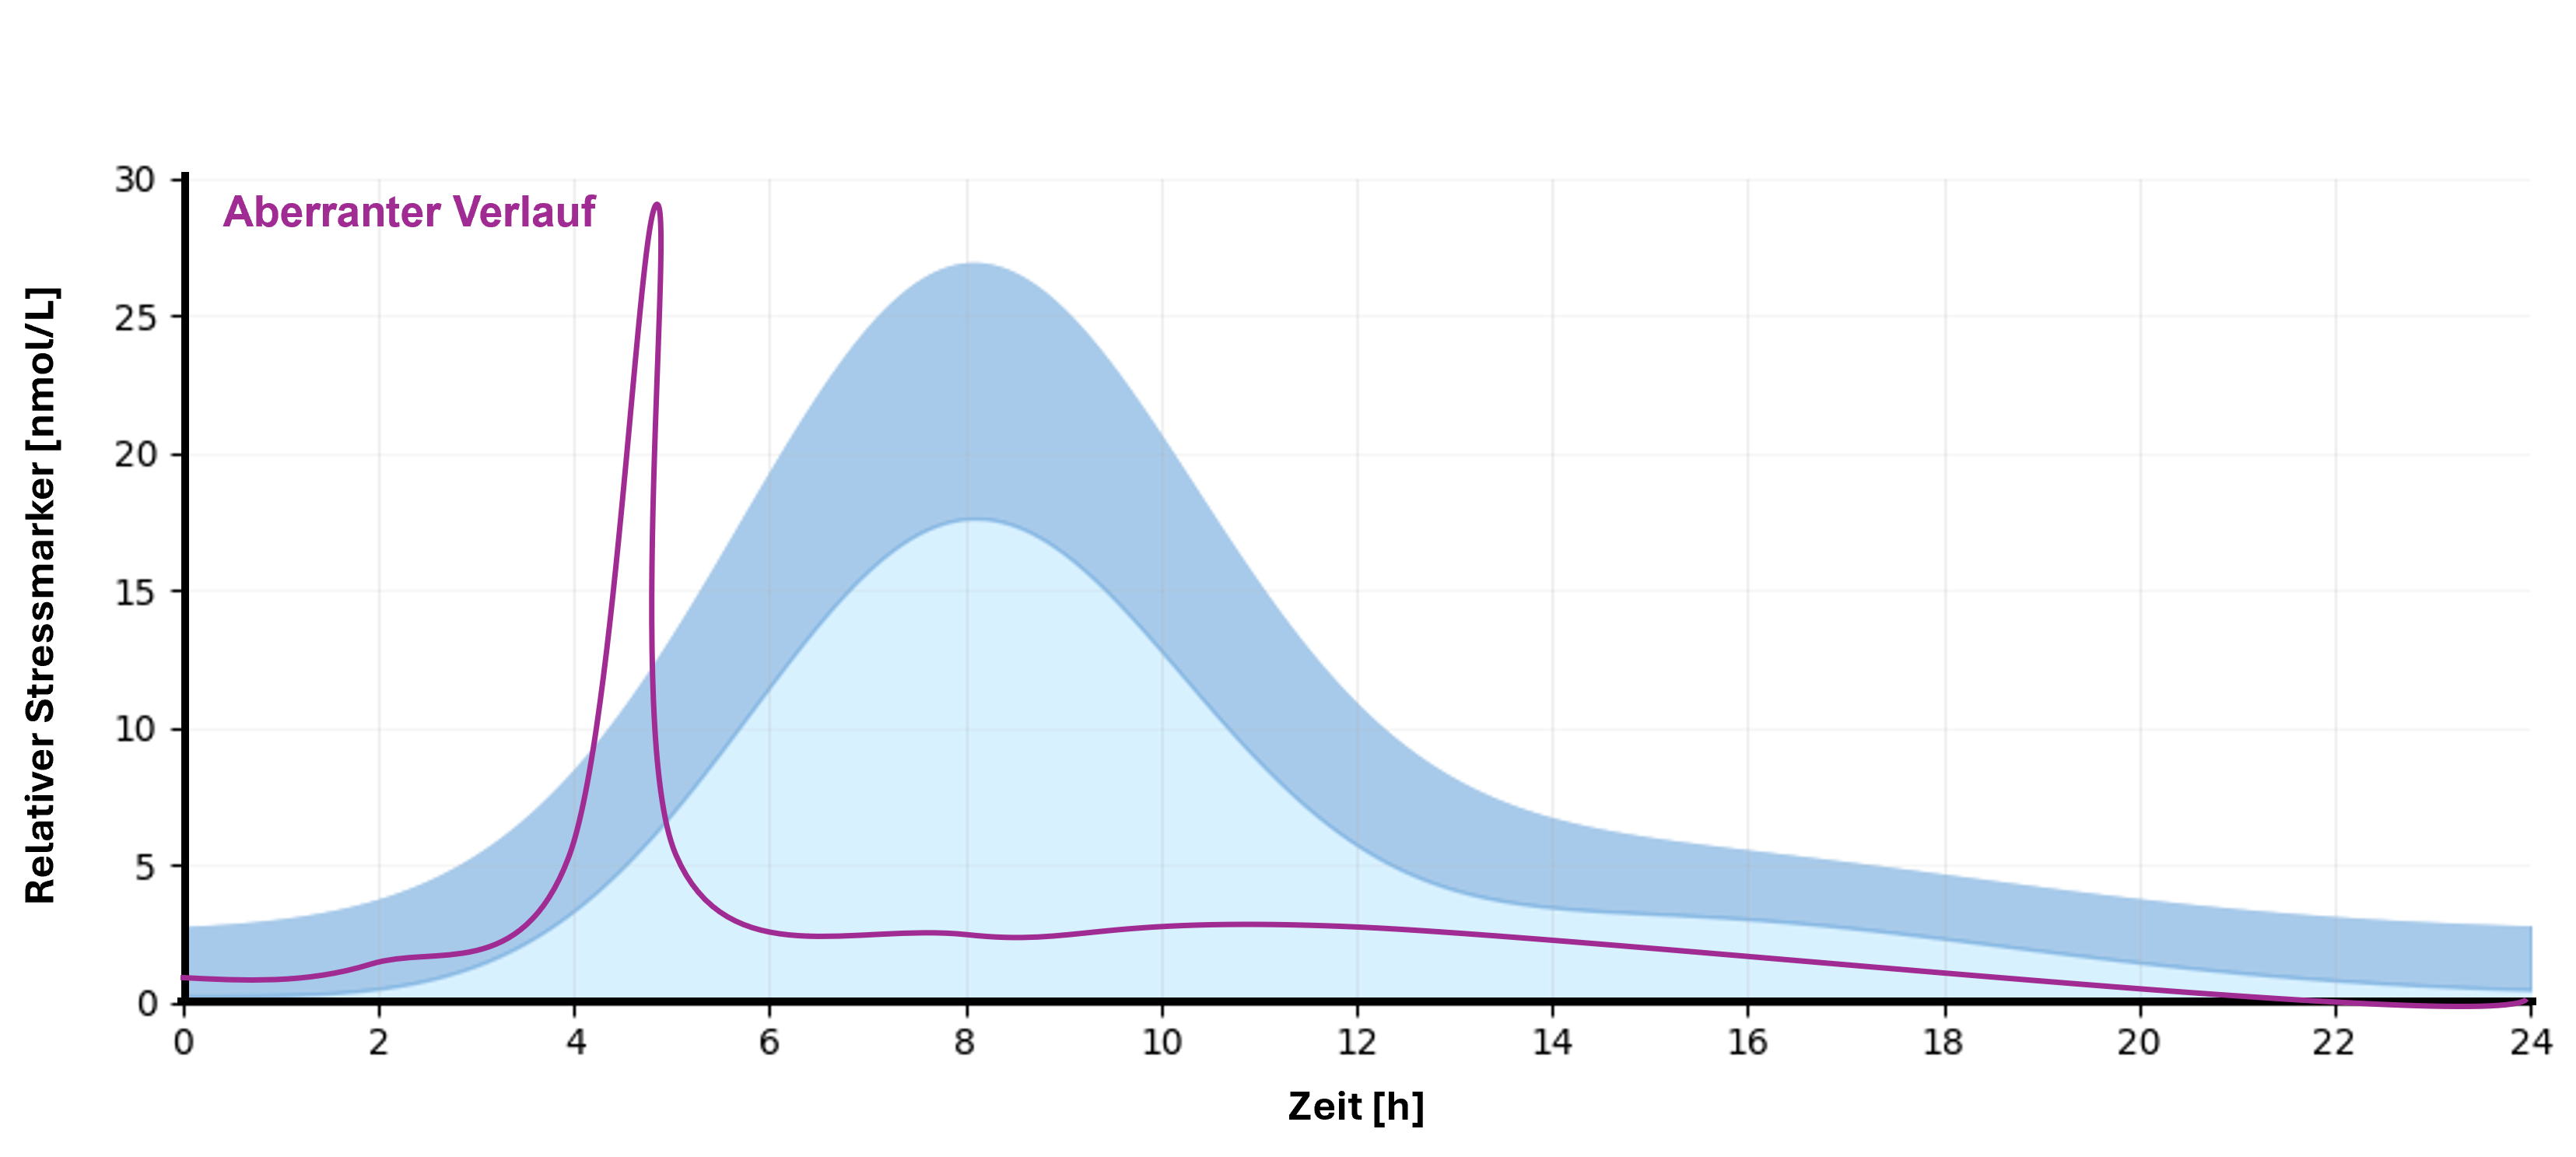
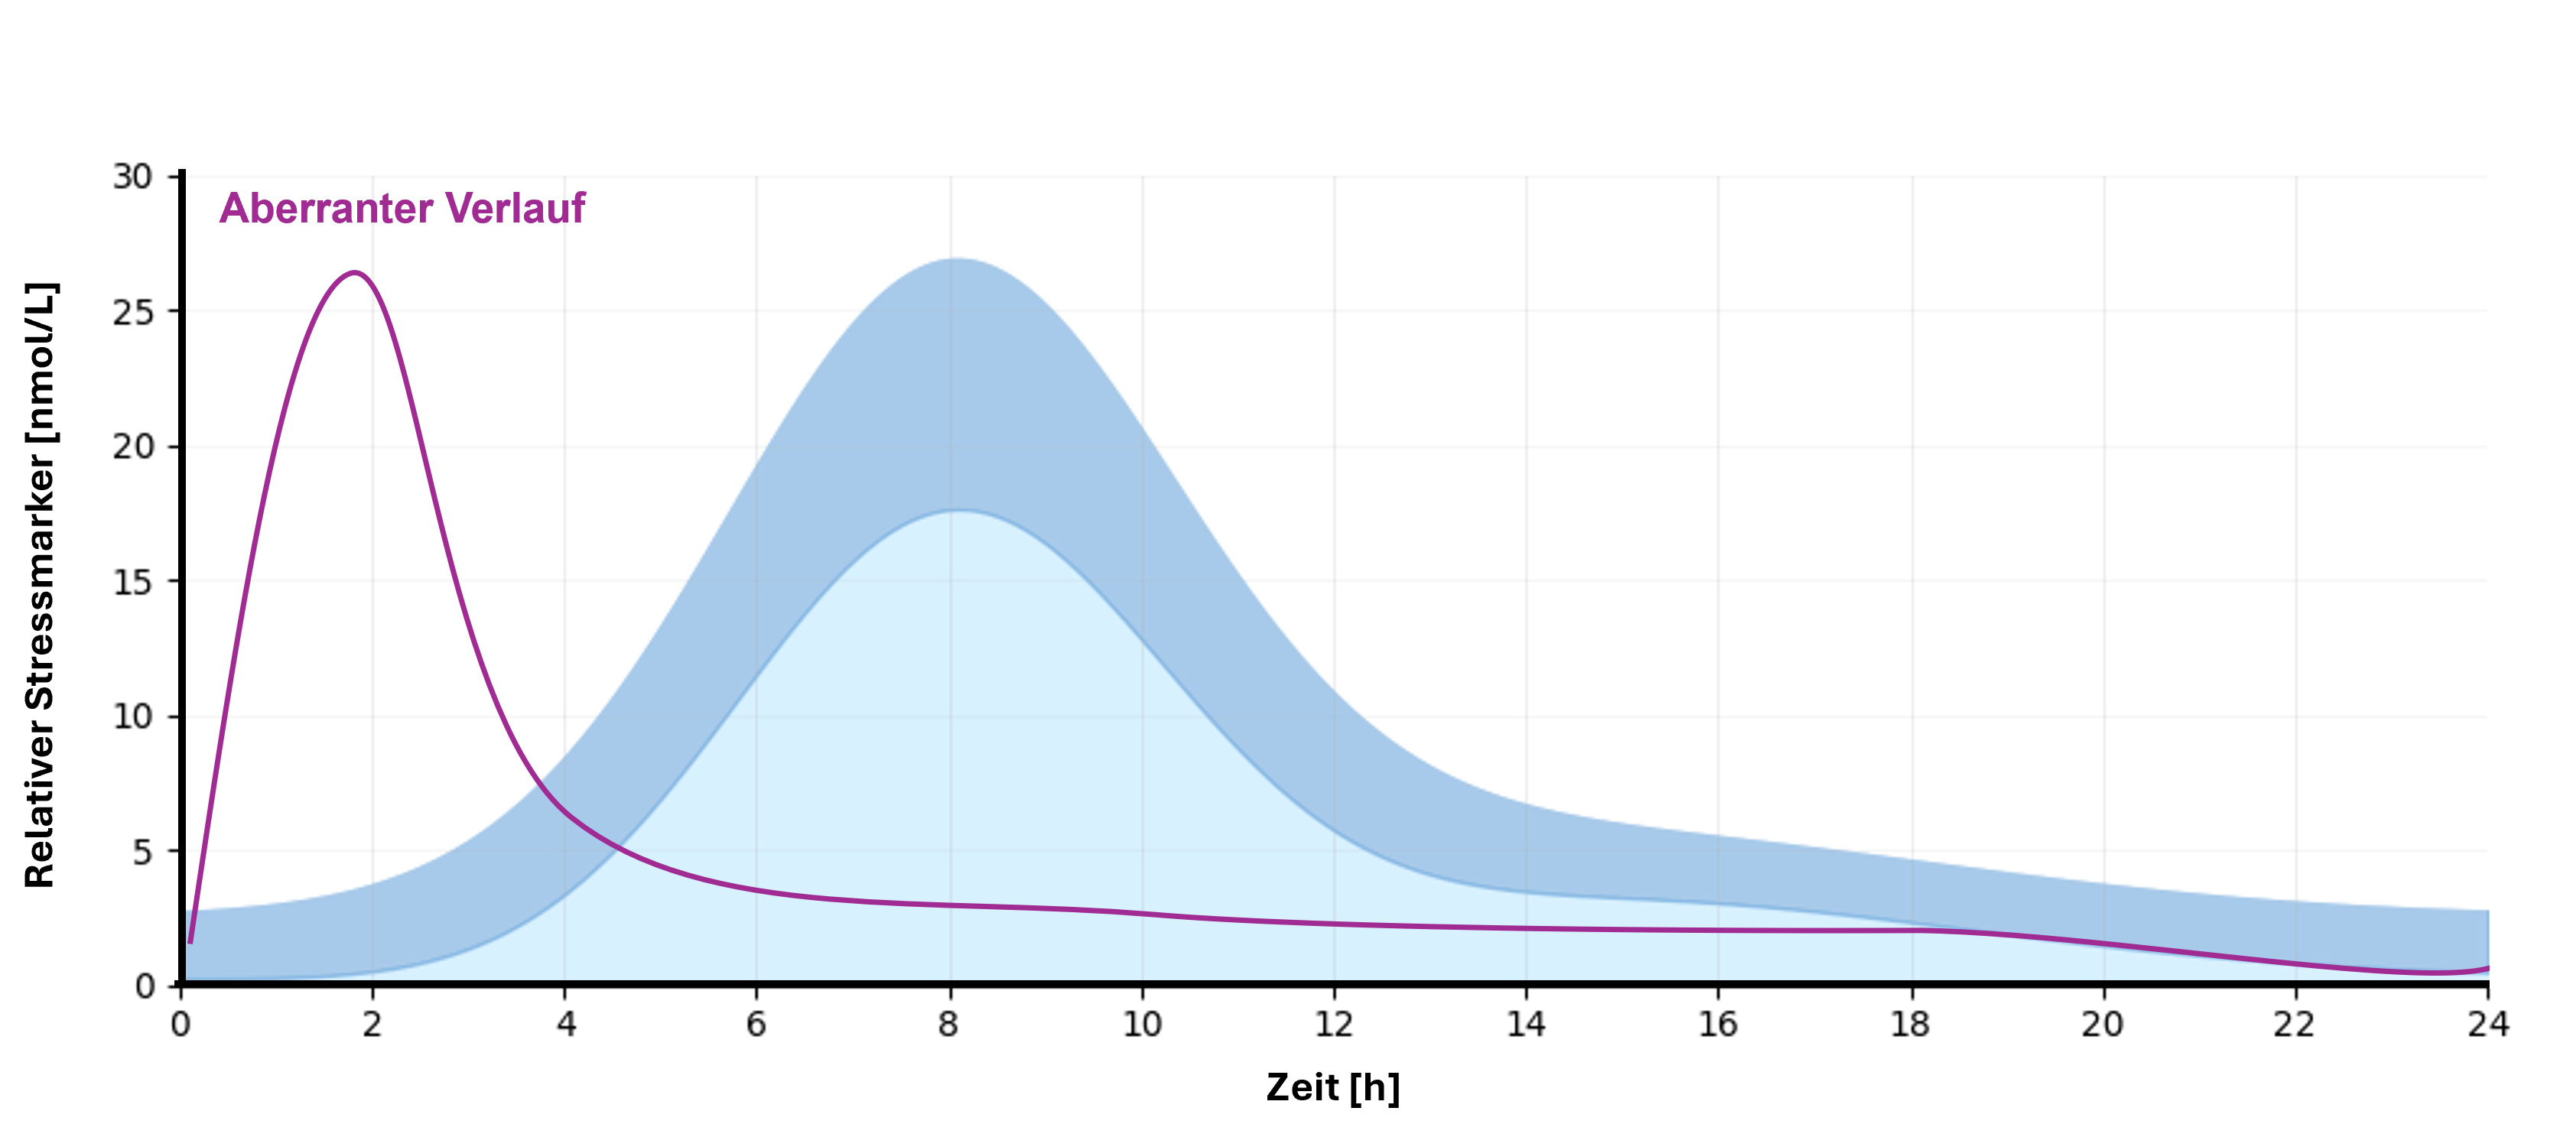
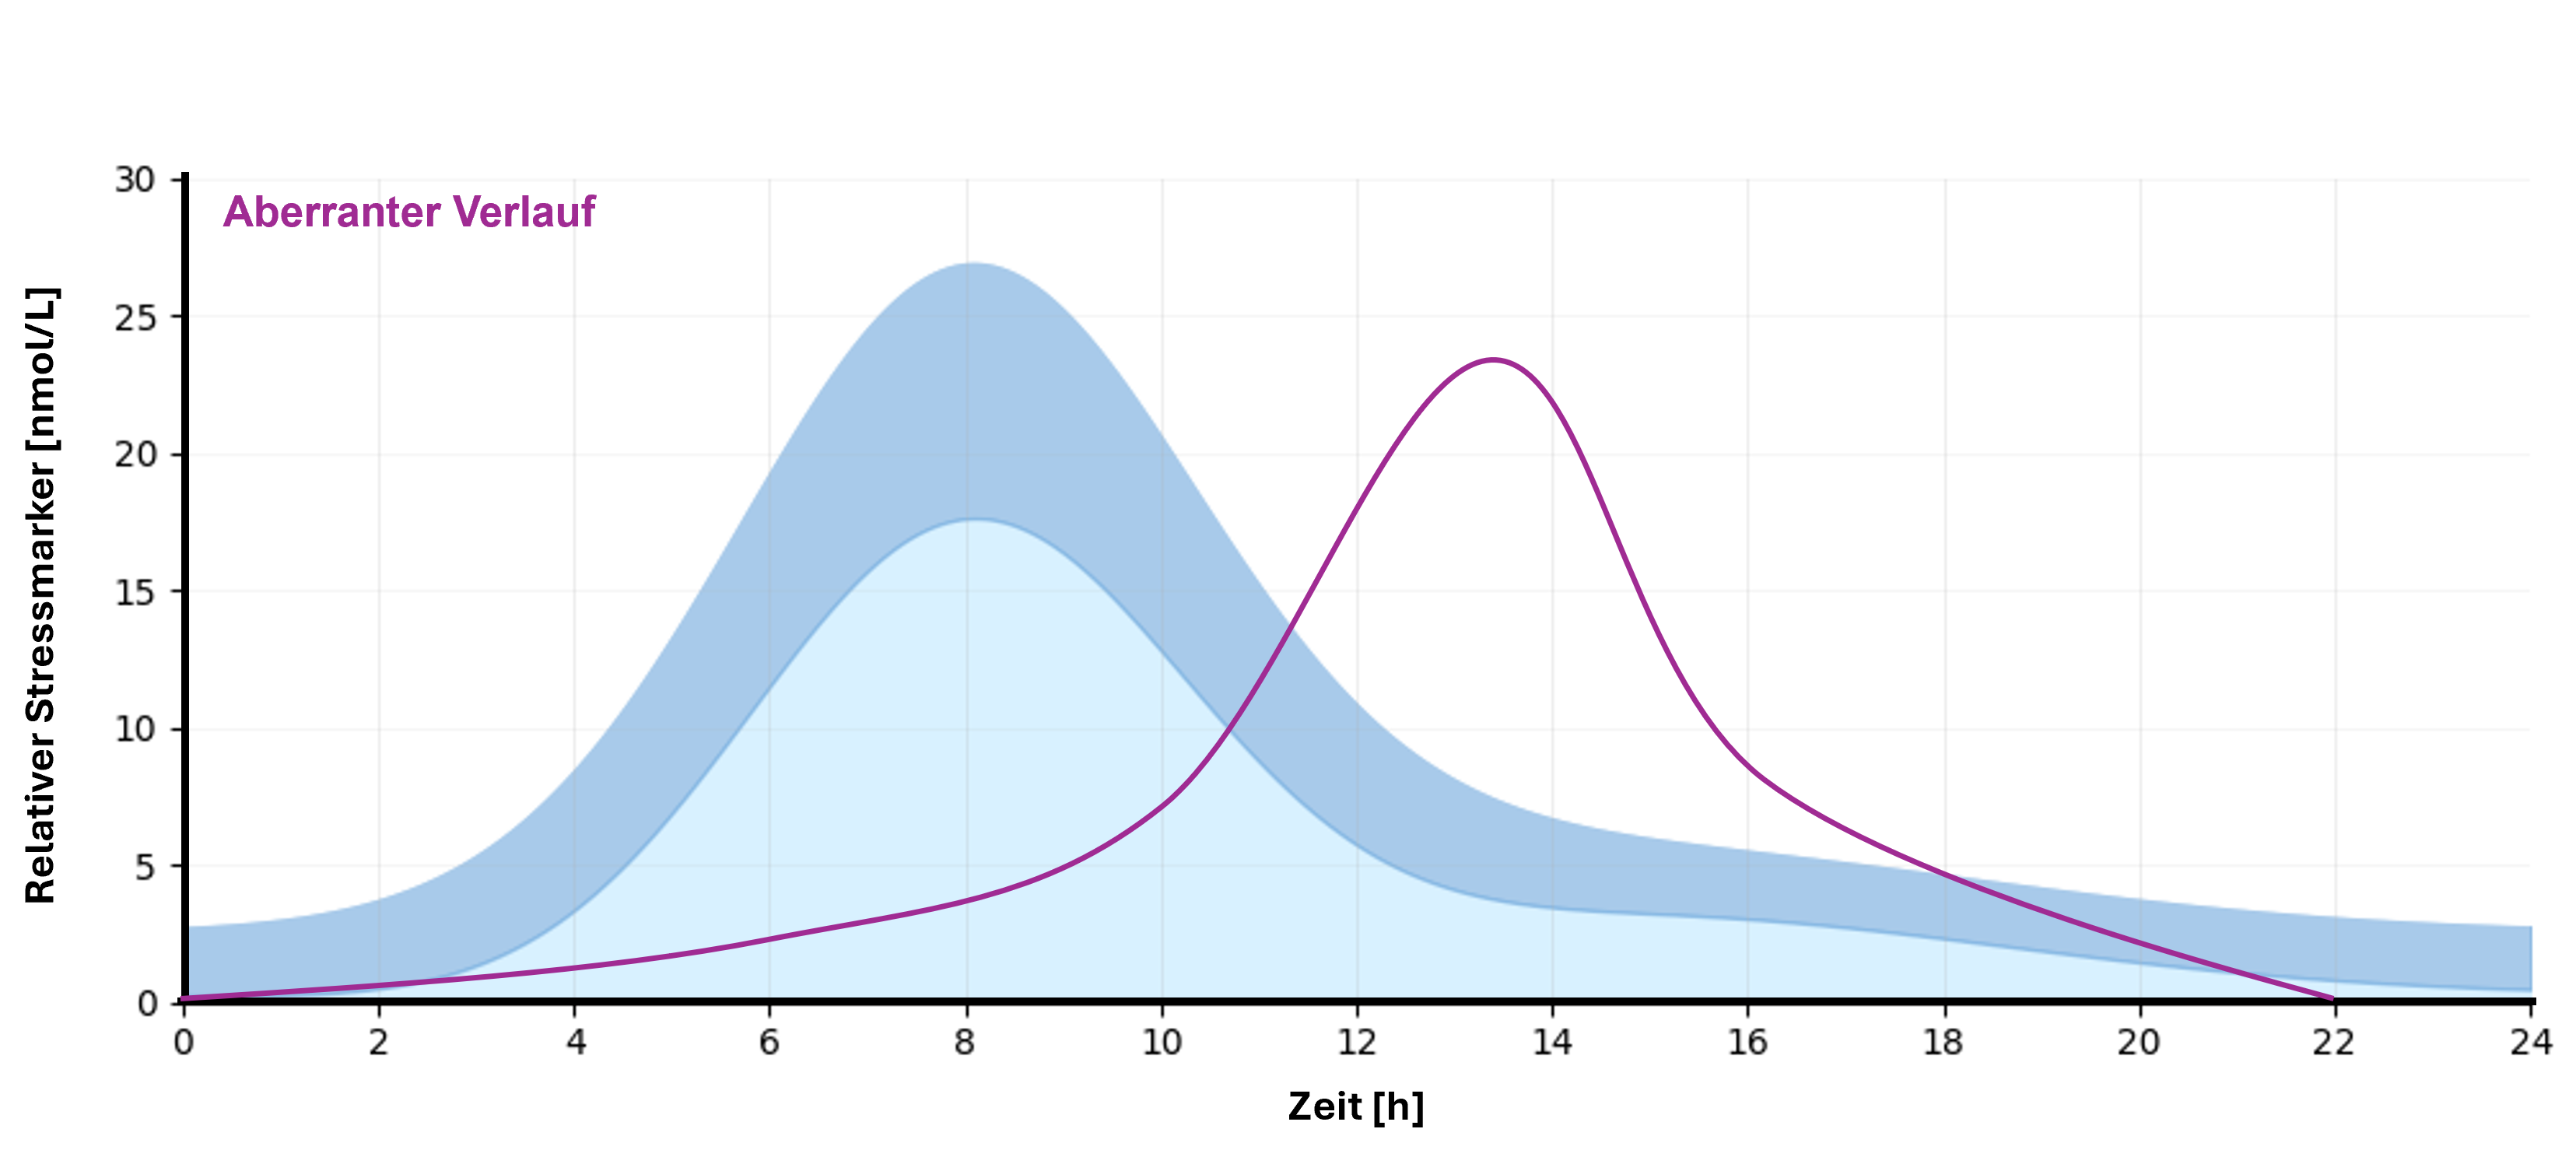
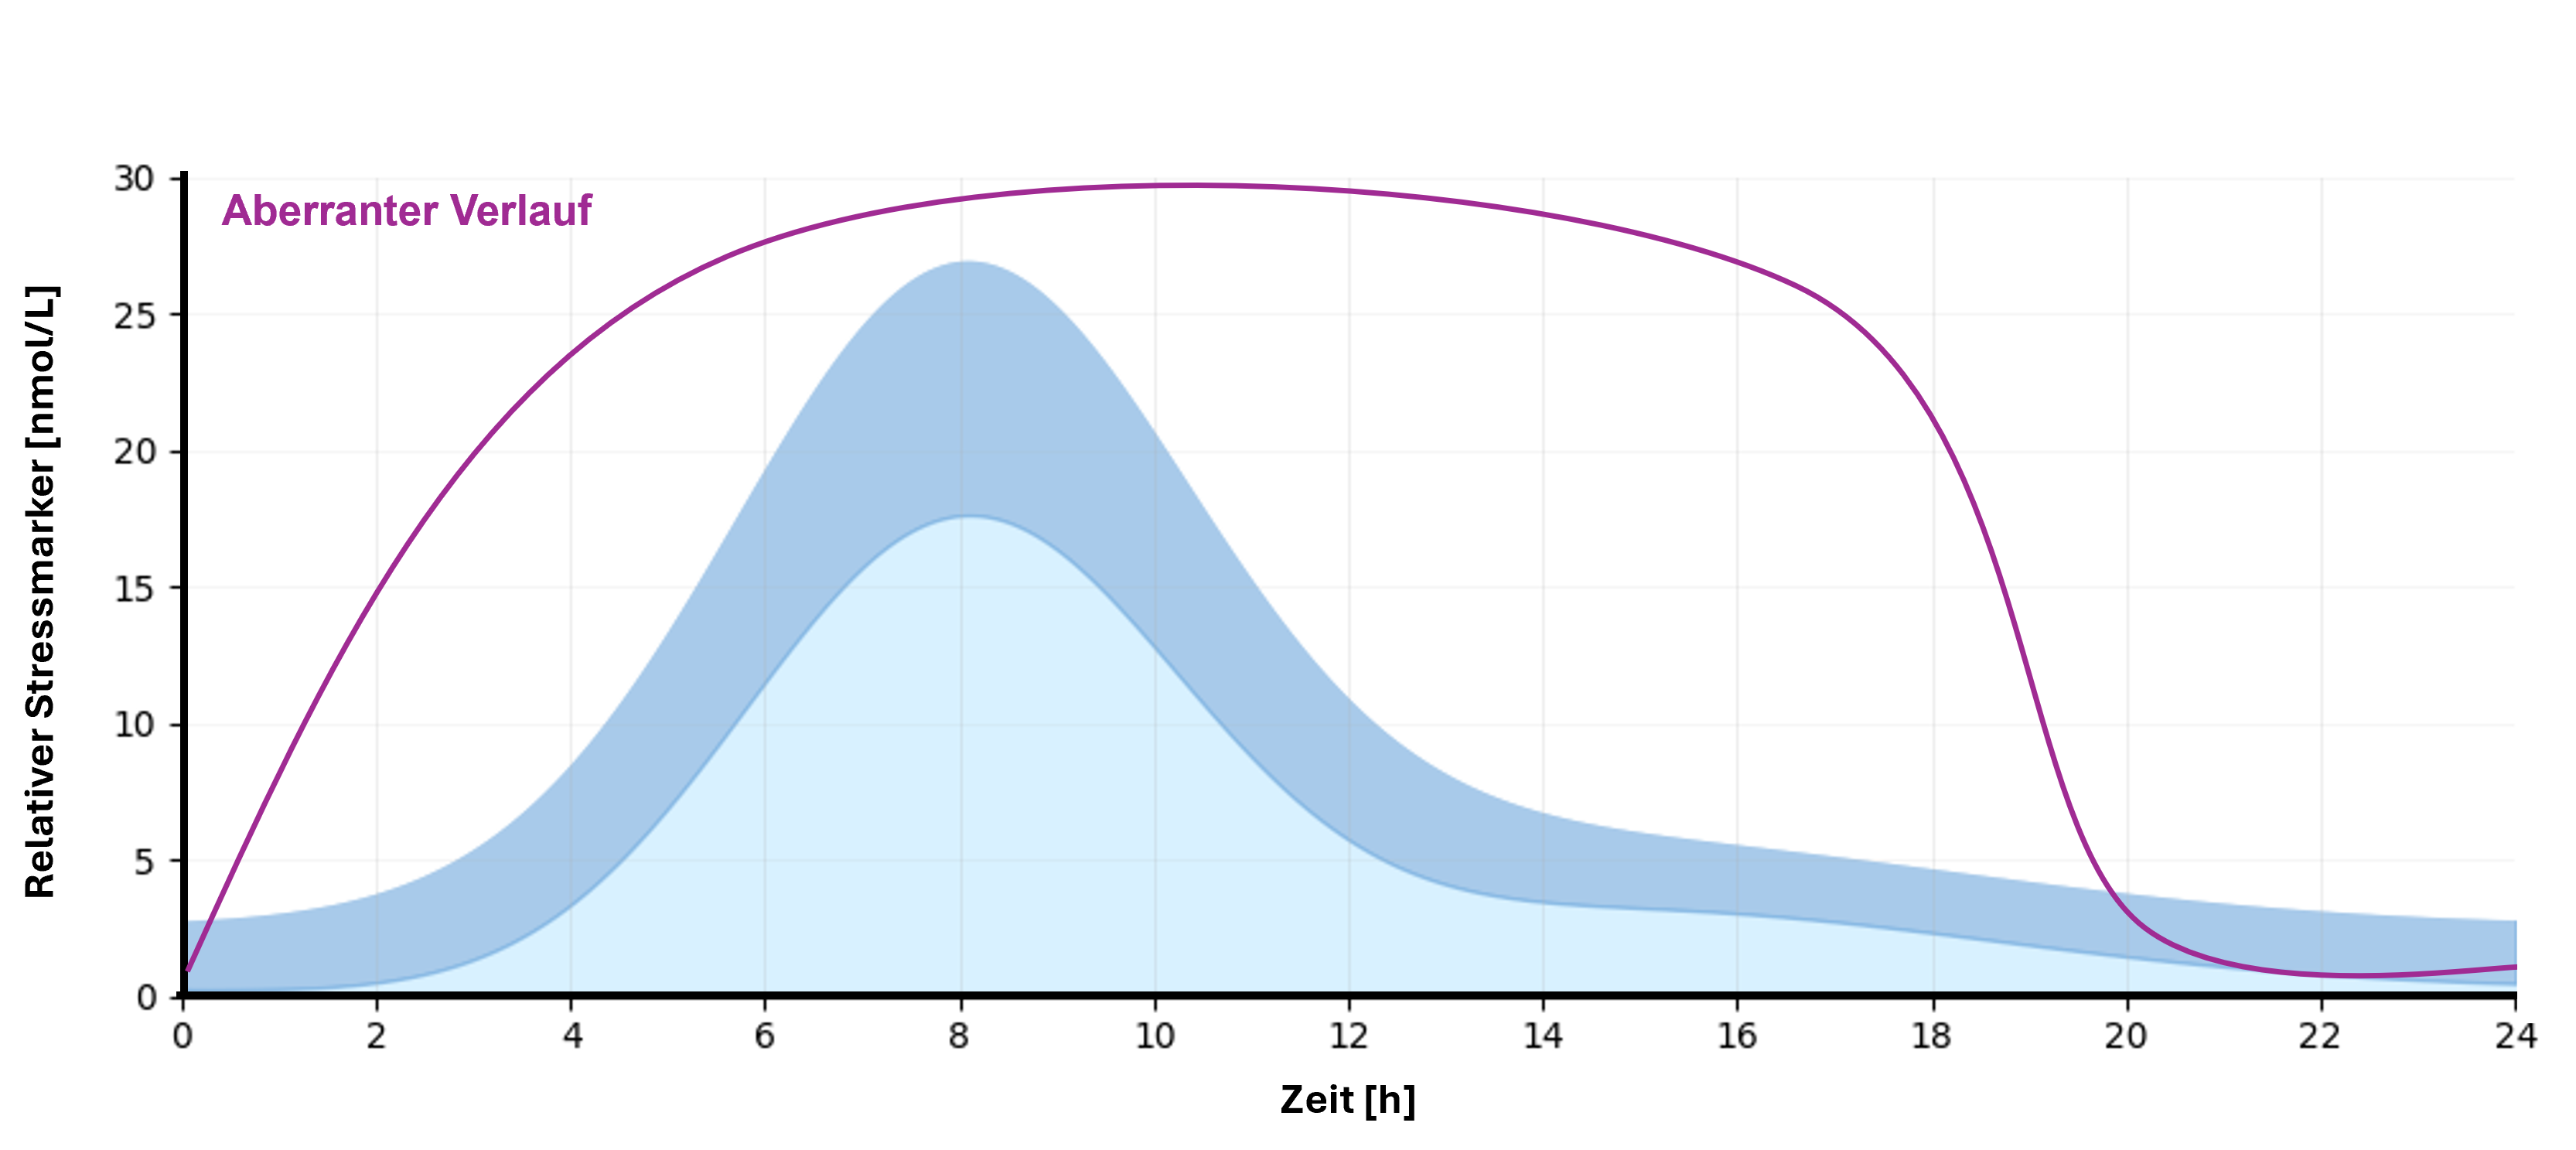
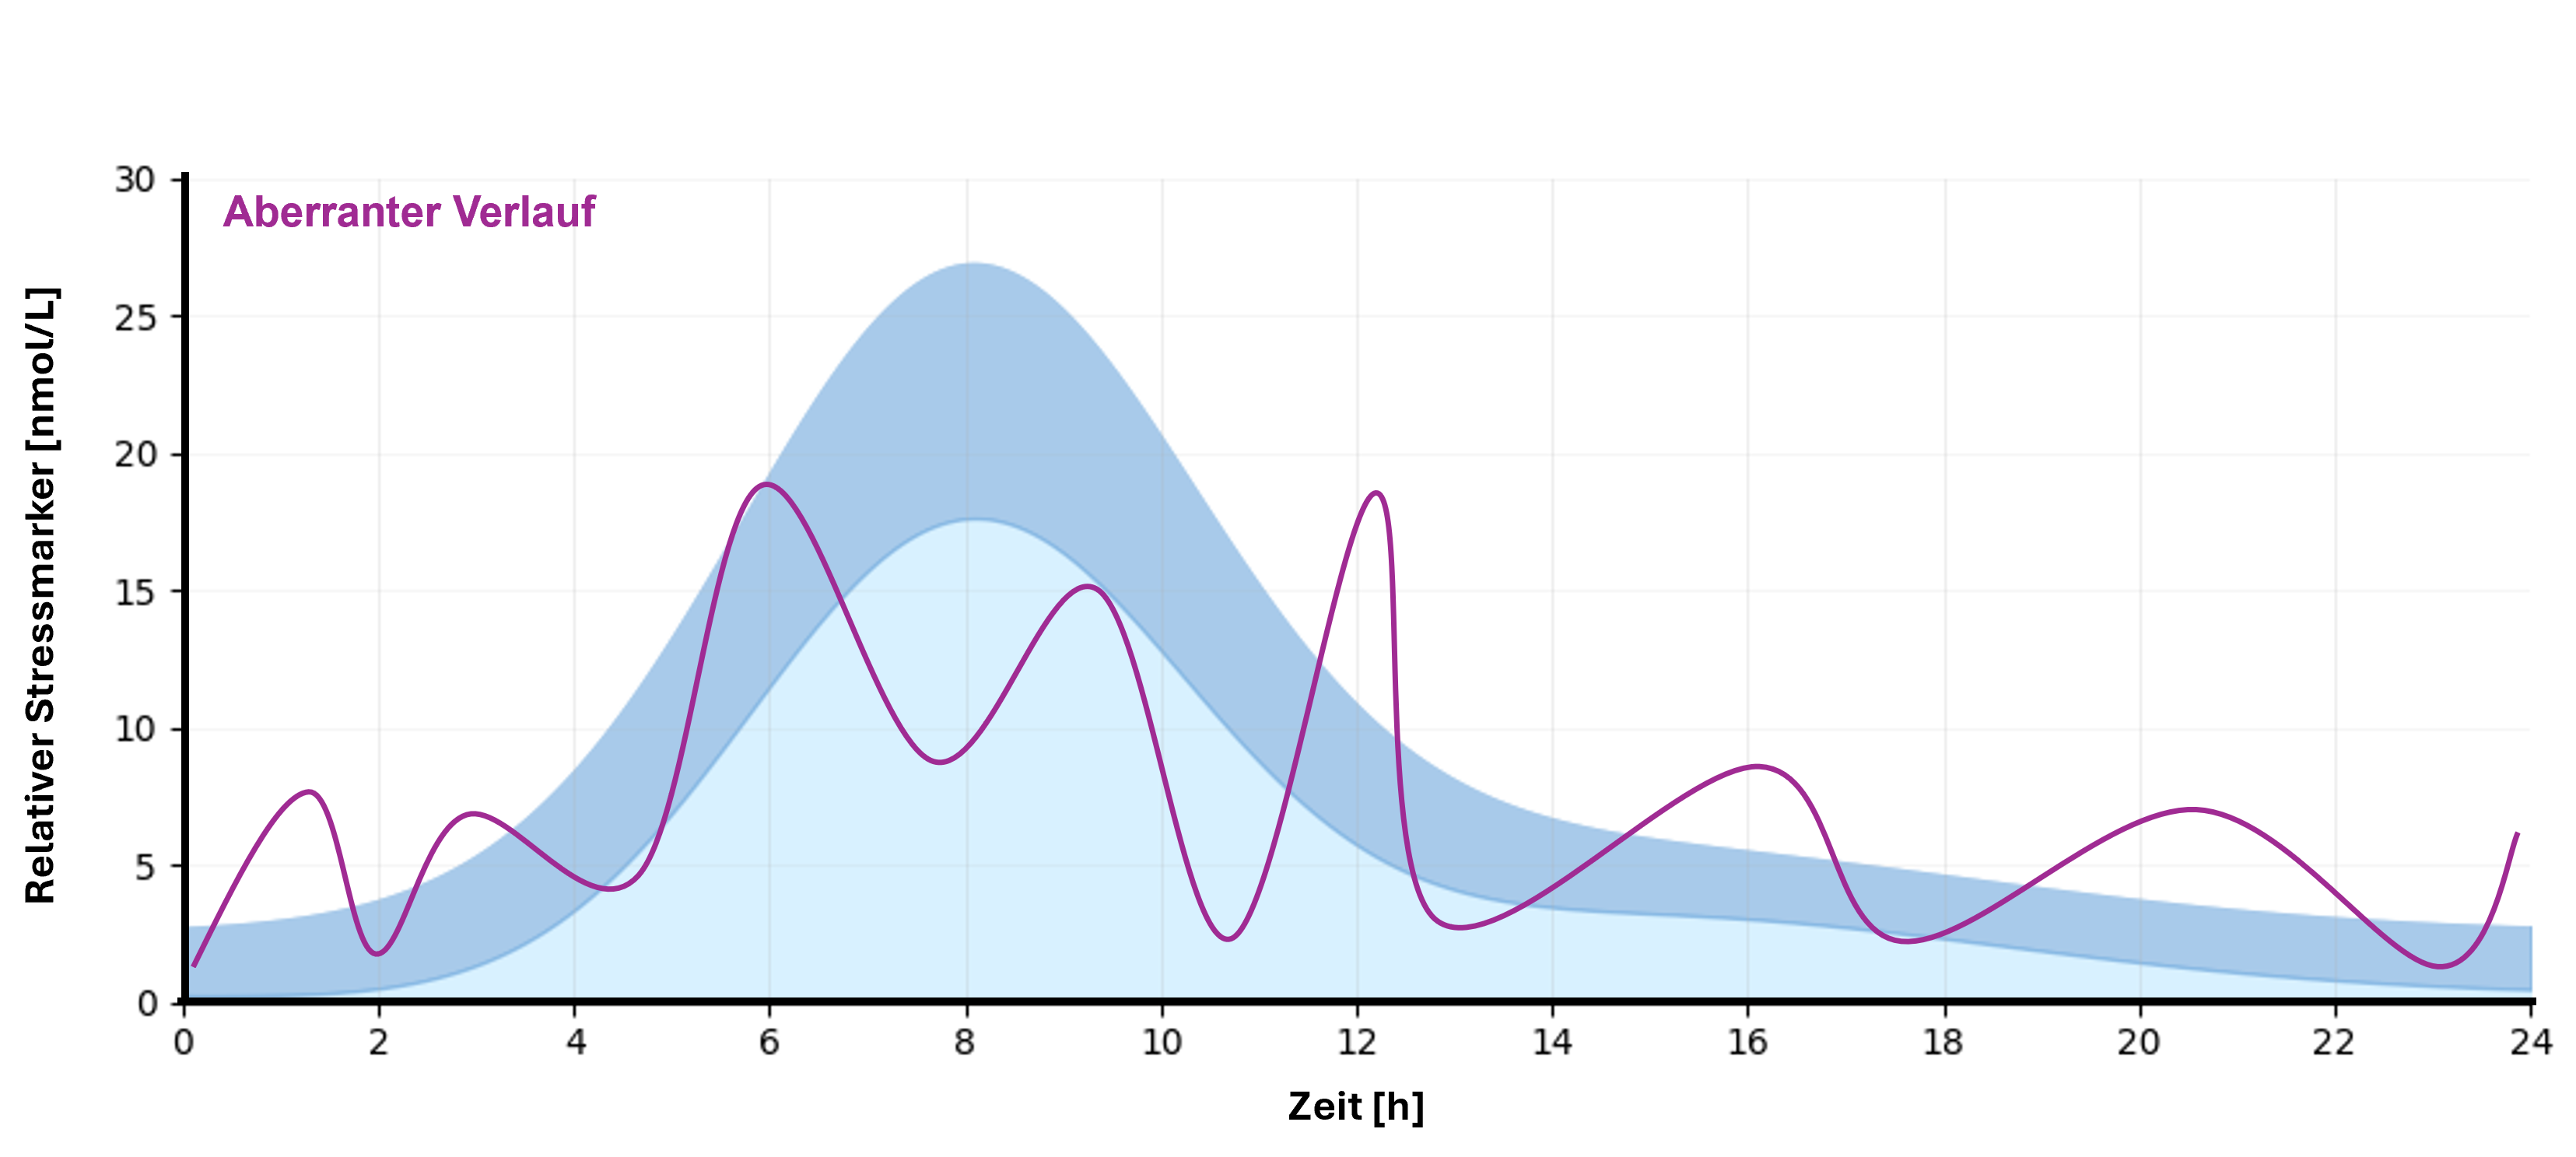
Stress becomes problematic mainly when activation persists for too long and the body does not reliably return to recovery. Repeated smaller stressors can be more biologically relevant than a single strong spike. This is why it is not enough to look only at the level of a value. What matters is how long the organism remains activated, how the values change over time and whether a return to regeneration is visible.

Without timing, everyday context and progression, a biomarker has limited informative value. Sleep, stress exposure, daily rhythm and specific everyday events influence what a value actually means. The same measured value can reflect different states in two people. Informative value therefore does not come from a single value, but from the interaction of progression, context and the overall profile.

Short-term stress, chronic stress and circadian dynamics

Stress can only be assessed meaningfully if acute activation, chronic load and daily rhythm are distinguished. A high value is not automatically problematic. What matters is whether the activation fits the situation, remains time-limited and whether the body returns to recovery.

Short-term activation is often useful. The body quickly provides energy, increases attention and improves responsiveness. What matters is that this activation remains time-limited. High intensity is not automatically problematic if a clear return to recovery is visible afterwards.

Chronic load is a different state than acute stress. When stress occurs regularly and recovery is insufficient, the organism remains longer in an activation mode that is biologically intended only for limited phases. Recovery can become flatter or more unstable, and the clear separation between stress exposure and regeneration becomes blurred. This is exactly why longitudinal data are important.

Not only the level of a marker is relevant, but also its position across the day. Activation, peak and decline must fit the biological daily structure. Early, delayed or sustained peaks can significantly change the interpretation. Circadian dynamics are therefore not additional information, but a central part of interpretation.

Why a biological overall profile is more robust than an isolated value

A single value shows only one excerpt. For stress assessment, it is crucial how biological markers change over time, when they rise, how they fall and in which context they were measured. This is why we do not look only at isolated measurement points, but at the interaction of progression, everyday context and multiple biological markers.

Cortisol is particularly informative when viewed over time. The focus is not on a single value, but on the shape, timing and dynamics of the curve. A single value cannot reliably distinguish functional activation from overload. Rhythm, decline and return to recovery are often more important than the absolute peak.

Biological signals become reliably interpretable only through context. Sleep, time of day, nutrition, activity and specific stress events influence what a marker means. Similar curves can reflect different states. Context helps distinguish whether a pattern appears functional, compensated or dysregulated.

A biological overall profile is more robust than a single curve. Multiple markers increase the plausibility of interpretation and reduce the risk of overvaluing individual peaks. The added value comes from a consistent profile that jointly assesses biological data, progression and everyday context.

Cortisol A and Cortisol B in the context of stress regulation

Click card A to display graph 1. Click card B to display graph 2.

Graph 1 for Cortisol A

Cortisol A in the context of regulation

The upper part of the graphic shows the normal daily course of cortisol: the value rises over the course of the day, reaches a typical peak and then falls again; the light blue area shows the normal range of variation. Below, additional biomarkers are shown as a color map: blue indicates low values, red indicates high values. This shows that not all markers are active at the same time, but instead follow their own daily patterns. Such rhythmic changes can be linked to normal biological processes, such as the sleep-wake rhythm, food intake, metabolism or inflammatory activity. For non-specialists, the image makes clear that cortisol follows a typical normal course, while other biomarkers also fluctuate by time of day and therefore reflect different body processes.

Graph 2 for Cortisol B

Cortisol B in the context of regulation

Although the cortisol curve in the upper diagram is closer to a normal daily rhythm, the color map below shows that many other biomarkers are not within the optimal range. Several markers are shown as too high across large parts of the day, while others remain noticeably too low. For non-specialists, this means that a single marker such as cortisol may already look better or largely normal, while other body systems may still be out of balance. Markers related to sleep, food intake, metabolism or inflammatory activity in particular can remain persistently elevated or too low and thereby indicate impaired regulation. The image makes clear that a more normal cortisol curve alone is not sufficient to assess the entire biological rhythm as stable.

Example cortisol courses of identified stress patterns

Click a pattern to open the detail container with graph and assessment.

Graph Normal Pattern

Normal Pattern

Example profile of an orderly biological dynamic.

  • Clear circadian peak
  • Good return to regeneration
  • Functional activation without sustained dysregulation
Graph High-Peak Profile

High-Peak Profile

Clearly elevated peak with preserved regulation that still requires assessment.

  • High activation peak
  • Interpretation is meaningful only with context
  • Can be adaptive or compensatory
Graph Low-Peak Profile

Low-Peak Profile

Flattened course with reduced activation dynamics.

  • Lower morning activation
  • Reduced dynamics
  • Assessment is reliable only within the overall profile
Graph No-Peak Profile

No-Peak Profile

Almost absent peak with limited biological readability.

  • Barely pronounced activation
  • Indication of altered regulation
  • Context data are particularly important here
Graph Rapid-Peak Profile

Rapid-Peak Profile

Rapid activation with an early change in the course.

  • Early and strong increase
  • Fast dynamics
  • Interpretation through progression rather than a single value
Graph Late-Shift Profile

Late-Shift Profile

Temporally shifted activation with a circadian abnormality.

  • Timing abnormality
  • Shifted peaks
  • Circadian dynamics are central to interpretation
Graph Right-Shift Profile

Right-Shift Profile

Backward-shifted dynamics with an altered daily pattern.

  • Later activation
  • Possible shift in stress regulation
  • Meaningful interpretation only with the overall picture
Graph Plateau-Peak Profile

Plateau-Peak Profile

Prolonged activation with reduced decline.

  • Broad plateau
  • Persistent activation
  • Limited return to recovery
Graph Multi-Peak Profile

Multi-Peak Profile

Several activation peaks distributed across the course.

  • Multiple peaks
  • Possible repeated stress stimuli
  • Interpretation is valid only with everyday context